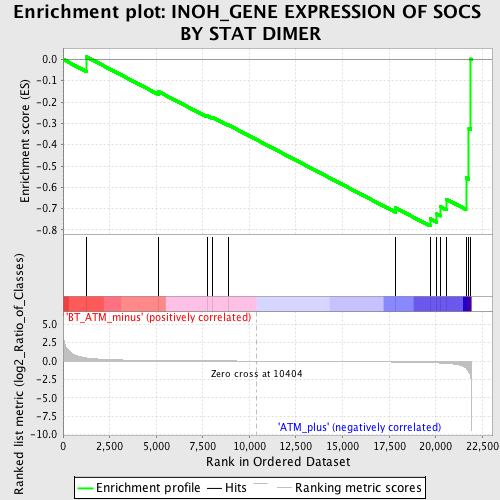
Profile of the Running ES Score & Positions of GeneSet Members on the Rank Ordered List
| Dataset | Set_02_BT_ATM_minus_versus_ATM_plus.phenotype_BT_ATM_minus_versus_ATM_plus.cls #BT_ATM_minus_versus_ATM_plus.phenotype_BT_ATM_minus_versus_ATM_plus.cls #BT_ATM_minus_versus_ATM_plus_repos |
| Phenotype | phenotype_BT_ATM_minus_versus_ATM_plus.cls#BT_ATM_minus_versus_ATM_plus_repos |
| Upregulated in class | ATM_plus |
| GeneSet | INOH_GENE EXPRESSION OF SOCS BY STAT DIMER |
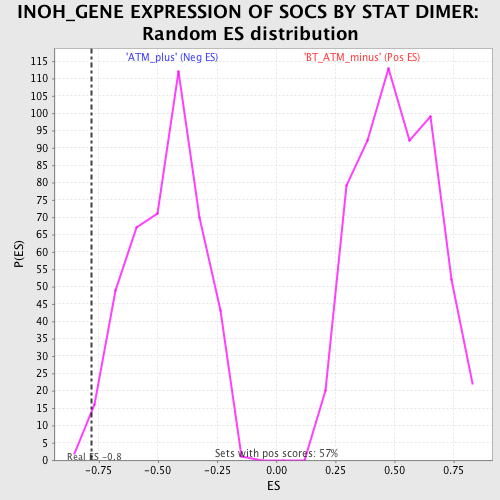
| Enrichment Score (ES) | -0.7812724 |
| Normalized Enrichment Score (NES) | -1.6675481 |
| Nominal p-value | 0.006960557 |
| FDR q-value | 0.26585618 |
| FWER p-Value | 0.989 |
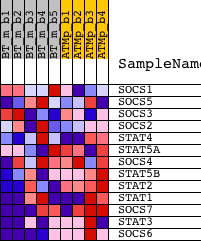
| PROBE | DESCRIPTION (from dataset) | GENE SYMBOL | GENE_TITLE | RANK IN GENE LIST | RANK METRIC SCORE | RUNNING ES | CORE ENRICHMENT | |
|---|---|---|---|---|---|---|---|---|
| 1 | SOCS1 | 1440047_at 1450446_a_at | 1254 | 0.432 | 0.0119 | No | ||
| 2 | SOCS5 | 1423349_at 1423350_at 1441640_at 1442890_at | 5140 | 0.084 | -0.1519 | No | ||
| 3 | SOCS3 | 1416576_at 1455899_x_at 1456212_x_at | 7730 | 0.037 | -0.2641 | No | ||
| 4 | SOCS2 | 1418507_s_at 1438470_at 1441476_at 1442586_at 1446085_at 1449109_at | 8002 | 0.033 | -0.2712 | No | ||
| 5 | STAT4 | 1448713_at | 8866 | 0.021 | -0.3073 | No | ||
| 6 | STAT5A | 1421469_a_at 1450259_a_at | 17853 | -0.128 | -0.6967 | No | ||
| 7 | SOCS4 | 1421273_at 1421274_at 1421275_s_at 1455142_at | 19709 | -0.212 | -0.7473 | Yes | ||
| 8 | STAT5B | 1422102_a_at 1422103_a_at | 20068 | -0.243 | -0.7248 | Yes | ||
| 9 | STAT2 | 1421911_at 1450403_at | 20281 | -0.268 | -0.6917 | Yes | ||
| 10 | STAT1 | 1420915_at 1440481_at 1450033_a_at 1450034_at | 20572 | -0.307 | -0.6558 | Yes | ||
| 11 | SOCS7 | 1420766_at 1434834_at 1438492_at 1455402_at | 21636 | -0.929 | -0.5556 | Yes | ||
| 12 | STAT3 | 1424272_at 1426587_a_at 1459961_a_at 1460700_at | 21793 | -1.500 | -0.3228 | Yes | ||
| 13 | SOCS6 | 1435492_at 1450129_a_at 1452764_at 1459350_at | 21892 | -2.058 | 0.0019 | Yes |